I have posted about Lancope’s StealthWatch product line in the past. You can find a basic overview covering StealthWatch and ISE HERE. How to setup a StealthWatch lab can be found HERE. In summary, the Lancope StealthWatch solution uses NetFlow to turn general network equipment such as routers, switches, data center virtual switching, wireless access points, etc into sensor points for security and network performance. Think of it as turning general network gear into a IDS with some IPS capabilities. Most modern network equipment supports NetFlow so its something you probably have but not harvesting for threat intelligence.
For those familiar with StealthWatch, you have seen the java based interface to carve into data. One major new innovation with the product line is a web based GUI. This post will give a brief demo of the new GUI interface.
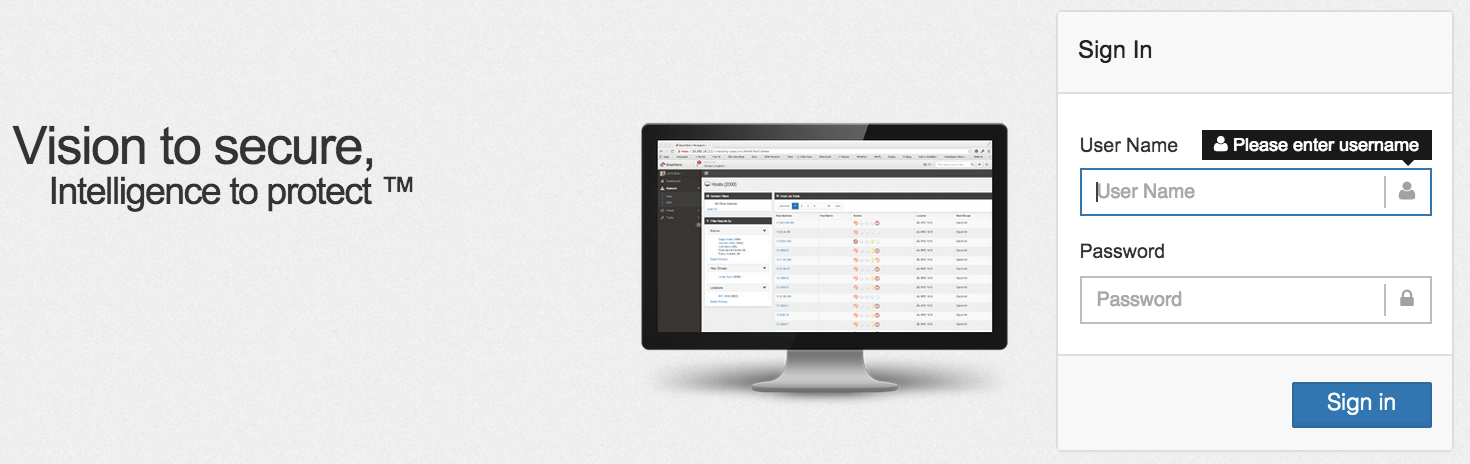 The first new thing I found when installing the latest StealthWatch solution was a new GUI based setup wizard. Basically I gave the manager known as the SMC (StealthWatch management center) a IP address using command line. From there, I accessed the system via a web browser for the remainder setup. Once I logged in, the setup wizard popped up.
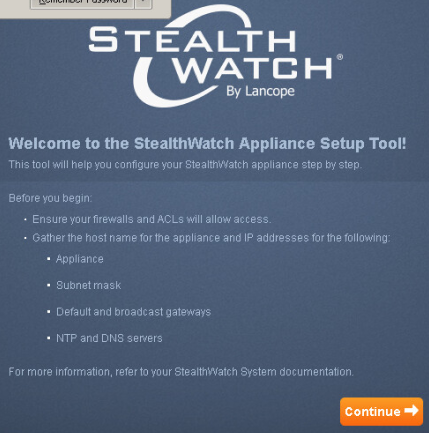 The setup wizard asks for basic network information, the IP address of the collector(s), any sensors and licenses. For those unfamiliar with StealthWatch, you need a collector to collect data from devices that can produce NetFlow and a Sensor turns standard traffic into NetFlow when NetFlow isn’t available. Once the wizard is compete, the system reboots and you are ready access the new GUI manager.
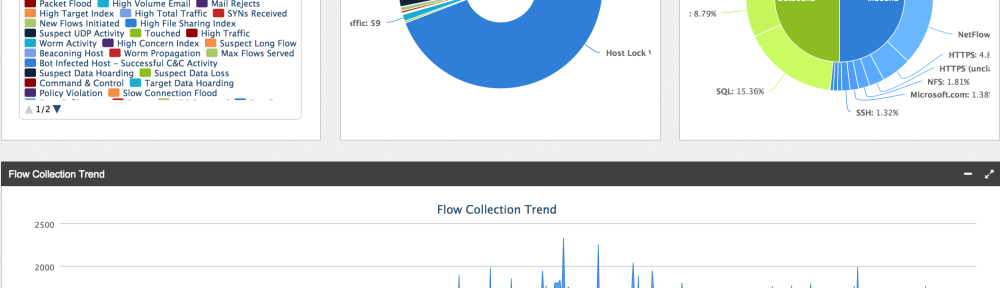
When things are setup and you log in, you will see the main dashboard GUI populated with data. (NOTE: StealthWatch needs a few days of NetFlow to baseline and start providing alerts since many rules are based on network trends. This is not true for things like unauthorized reconnaissance but required for alerts based on anomalies. An example is malware scanning the network using nmap would trigger a alarm regardless of trends while a person moving data for the first time to dropbox would be a trend of interest).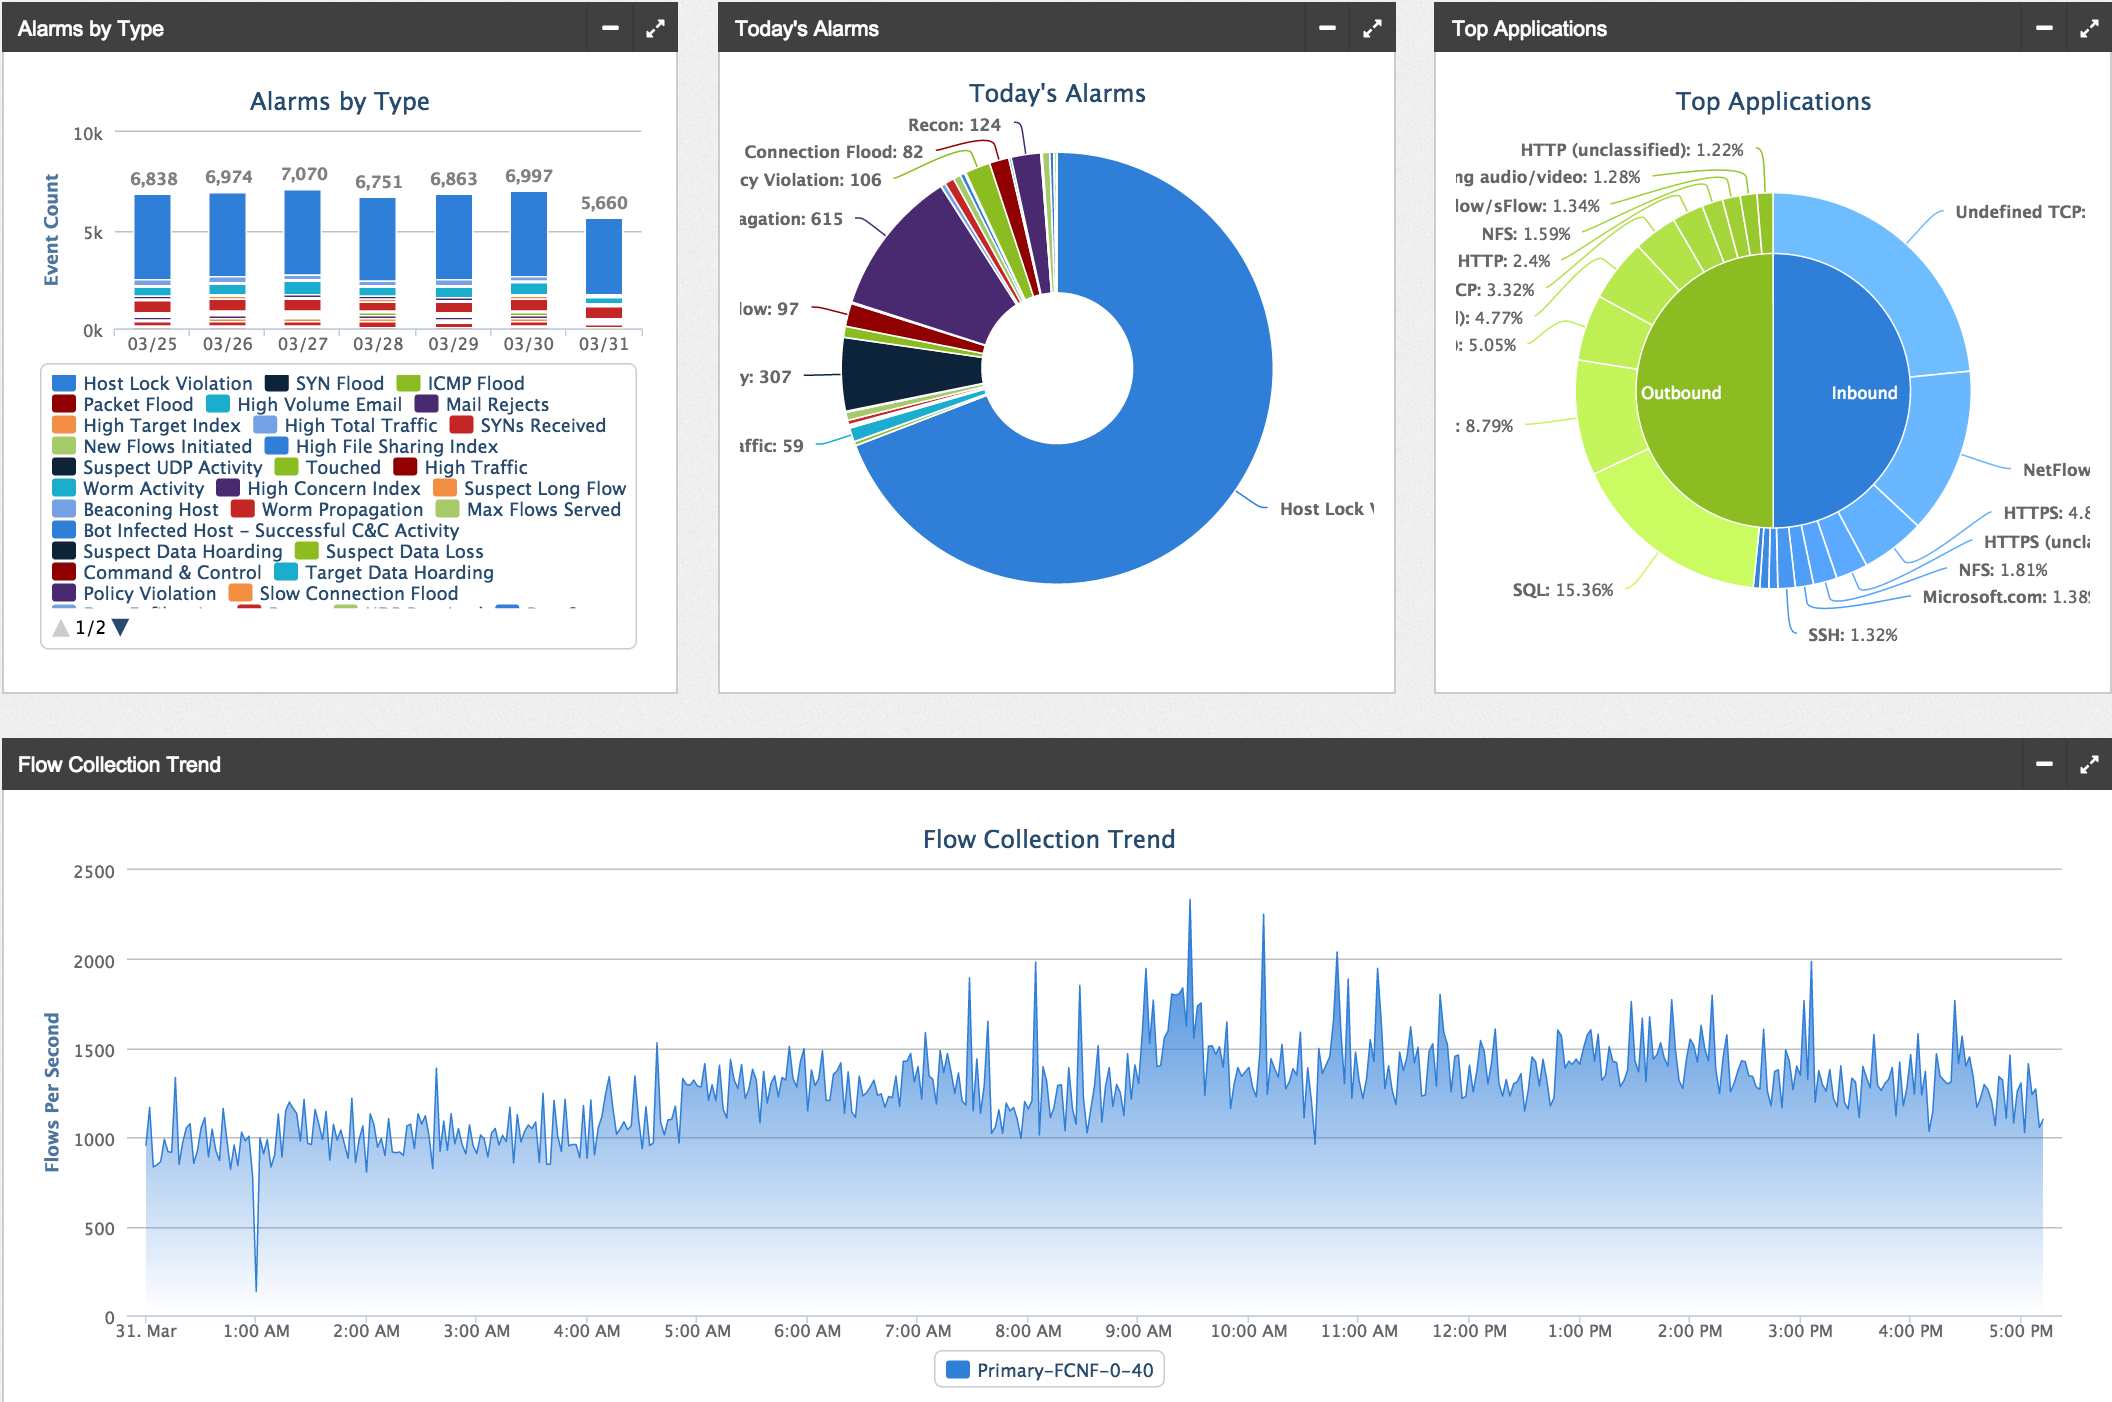
Most data shown in the screenshots can be investigated by clicking it. For example, I noticed a ton of Host Lock violations (aka unauthorized communication between a trusted and untrusted system) so when I click that part of the graph, I see the following list of alerts. This provides a list showing the source, target and type of communication between the systems. Think of this as an authorized system accessing a PCI server on a secure network. 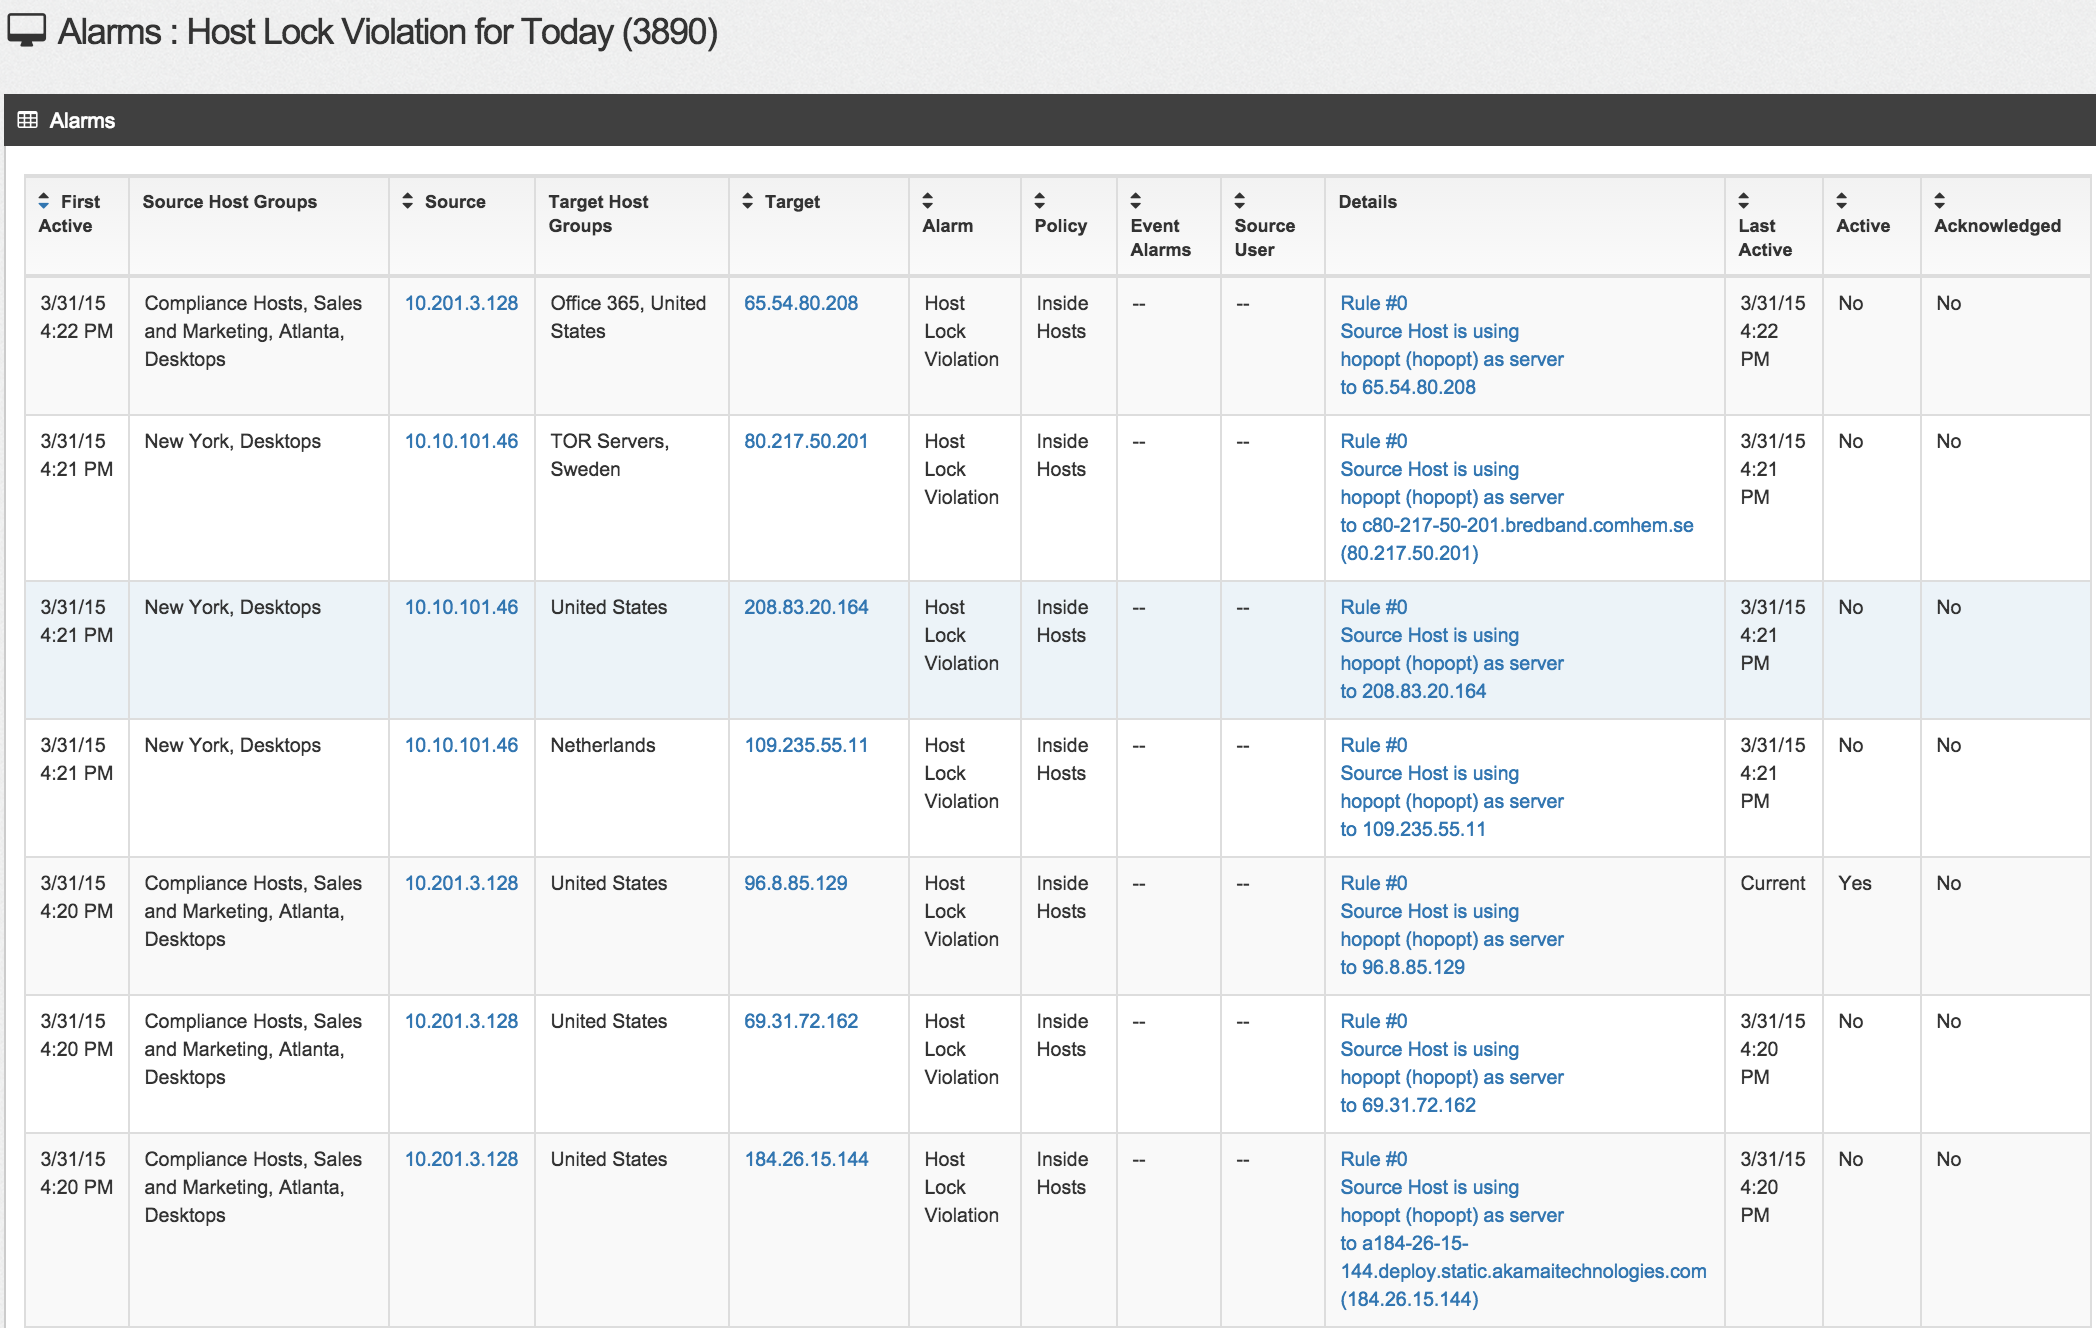
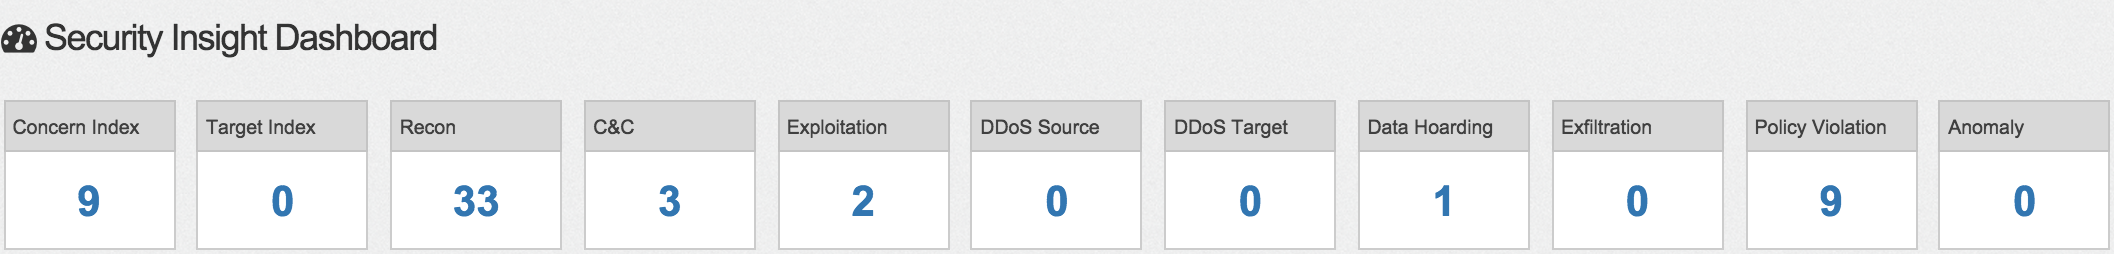
At the top of the main dashboard are a bunch of small widgets showing various types of security alarms. This is where StealthWatch is unique since many of the default settings are designed to identify various methods attackers use to breach networkers. Each widget can be clicked such the Recon widget shown in the next screenshot to dive into what is triggering the alarm.
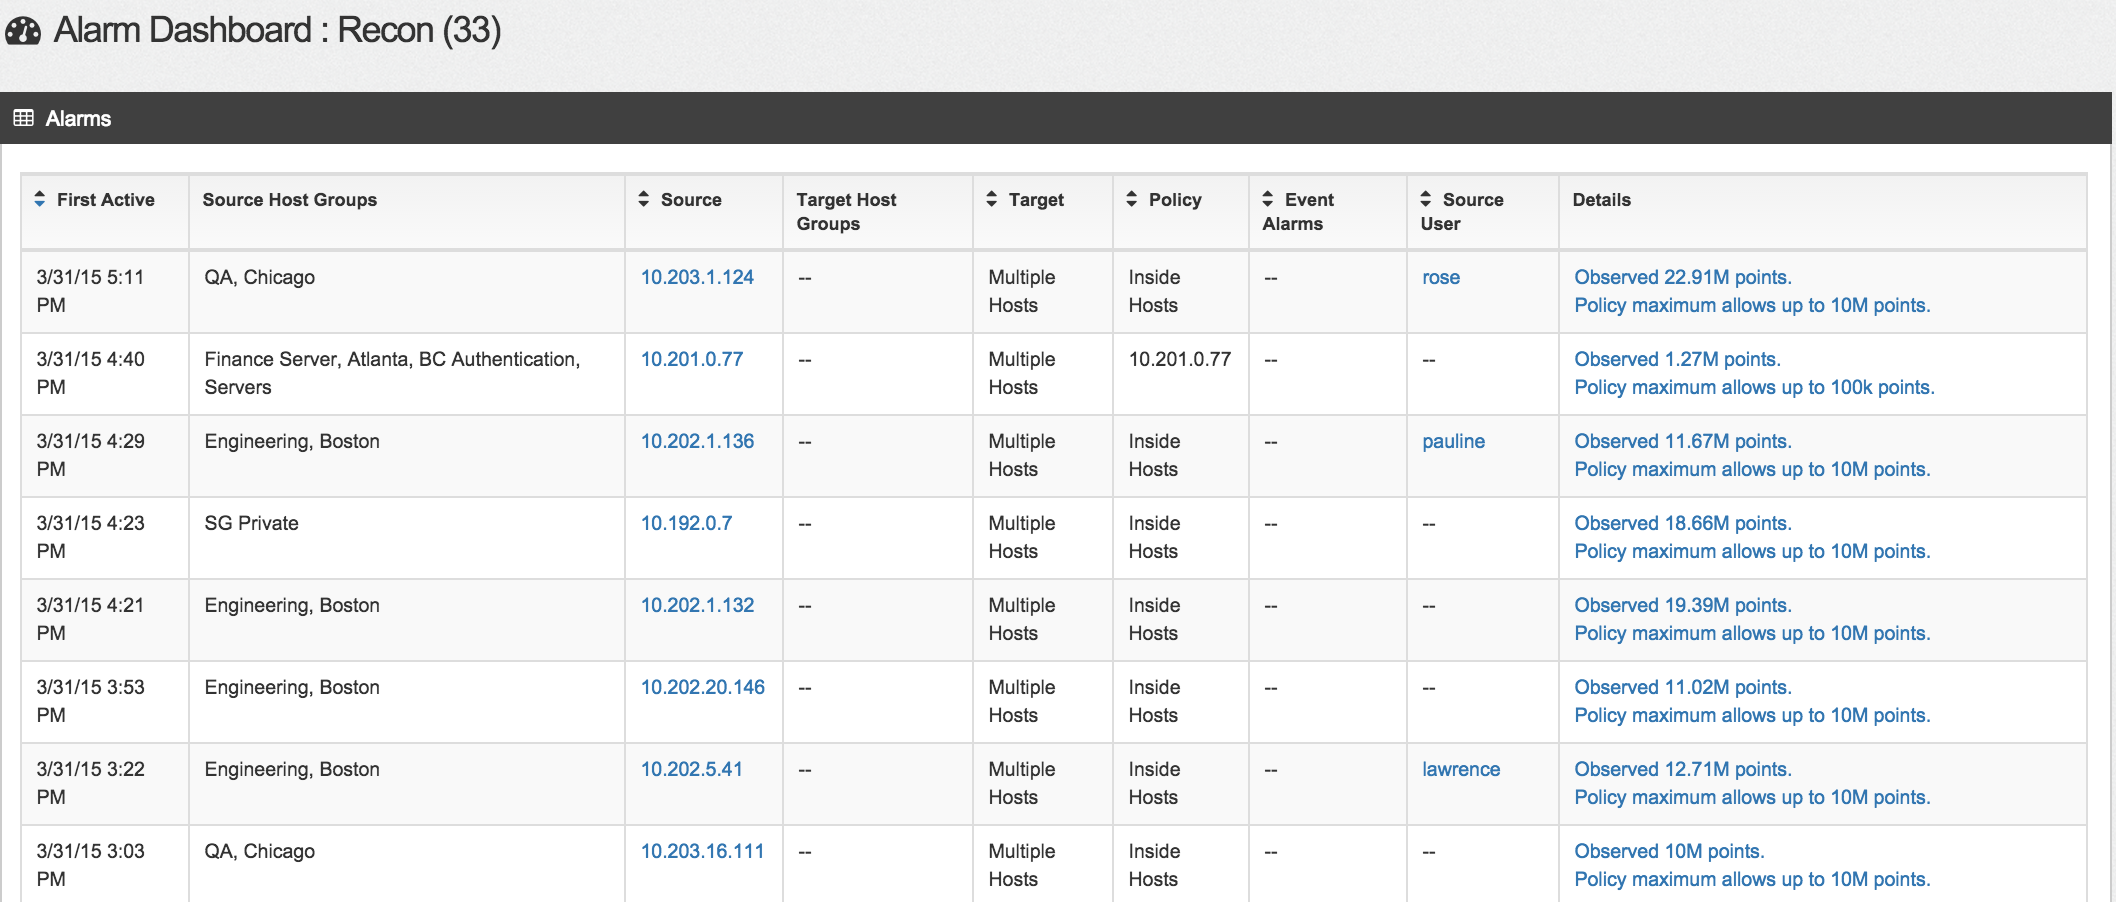
The Recon dashboard example shows there are a few users scanning multiple networks, which could be an attacker or malware looking for systems to compromise.
There is a host dashboard that puts host risk data into a chart like format making it easy to identify who you should investigate regarding various security events listed on the left alarm table. For example the next screenshot shows a handful of hosts that are infected with malware and communicating with known command and control systems. 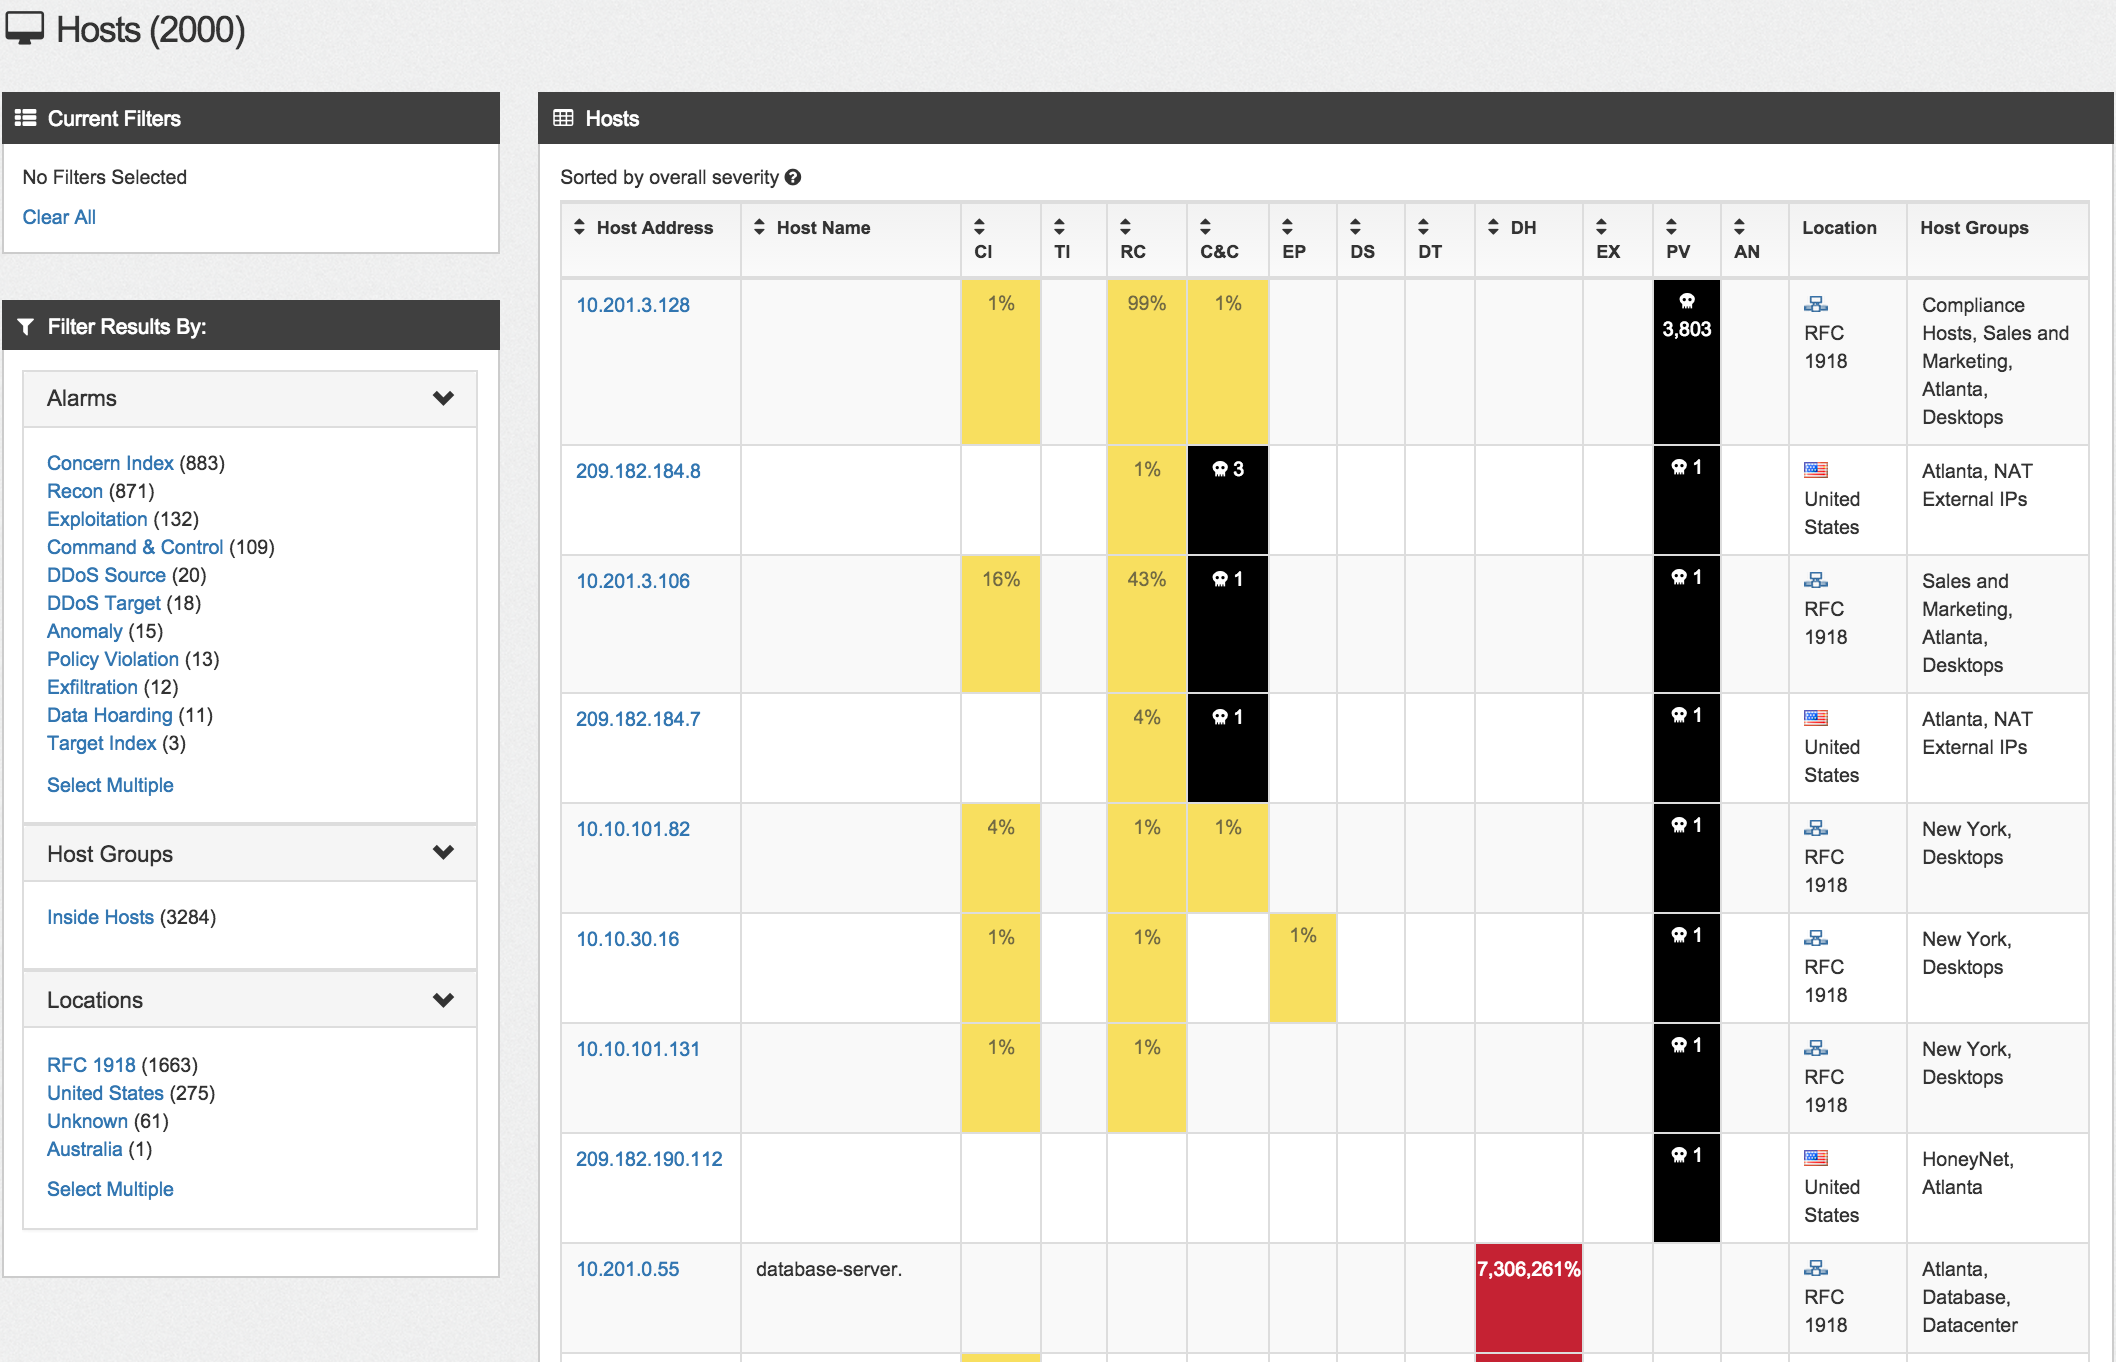 If authentication such as Active Directory is integrated, you can show a similar dashboard with user data.
 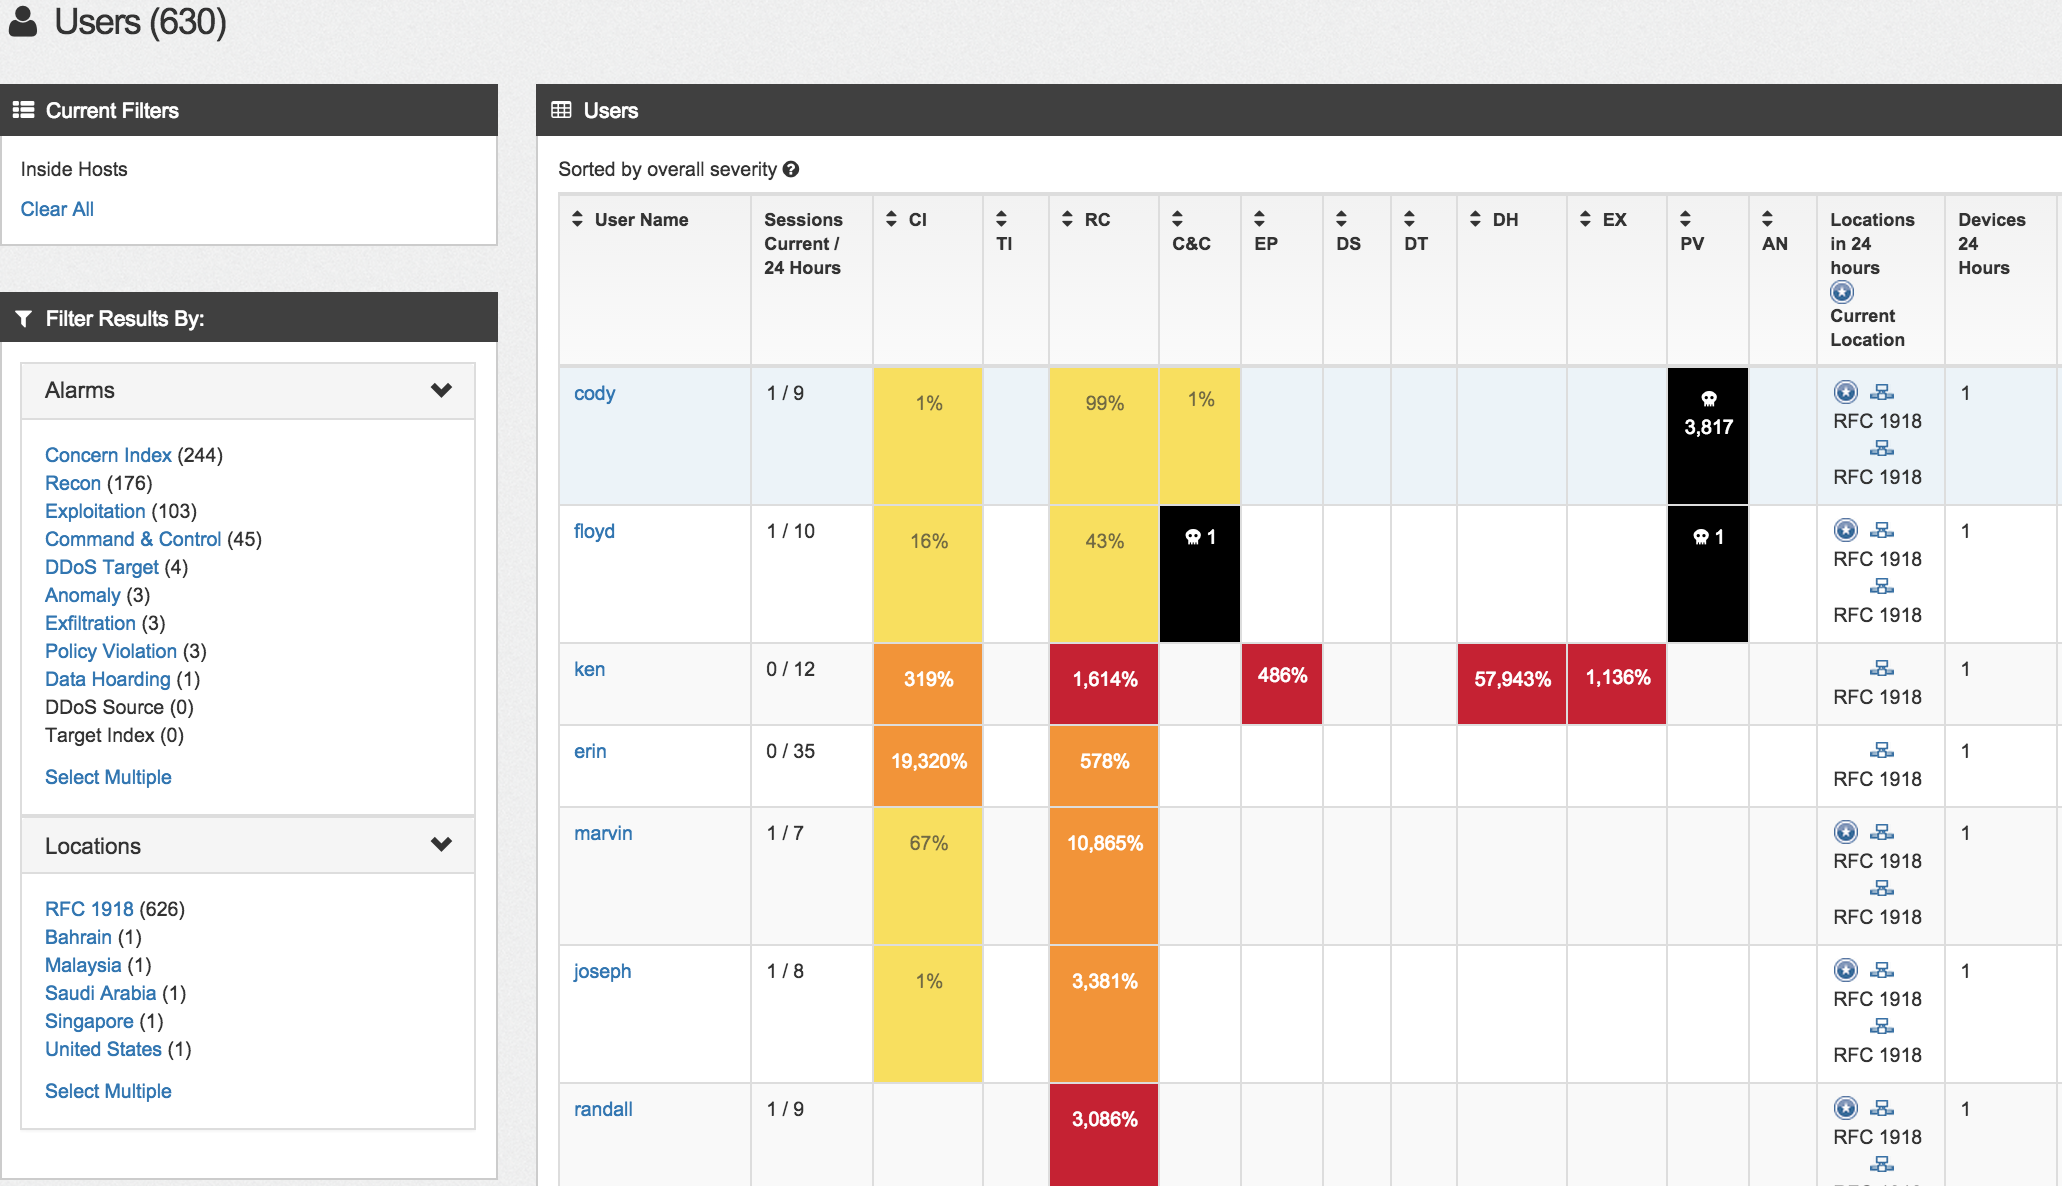 So in summary the new StealthWatch GUI is pretty cool for a high level view of event data. You can do some digging however for deeper investigations, you will have to click the java launch button to access the traditional application. Word is Lancope is investing a ton into this new GUI. So far, its coming along pretty nicely and great as a first responder dashboard.
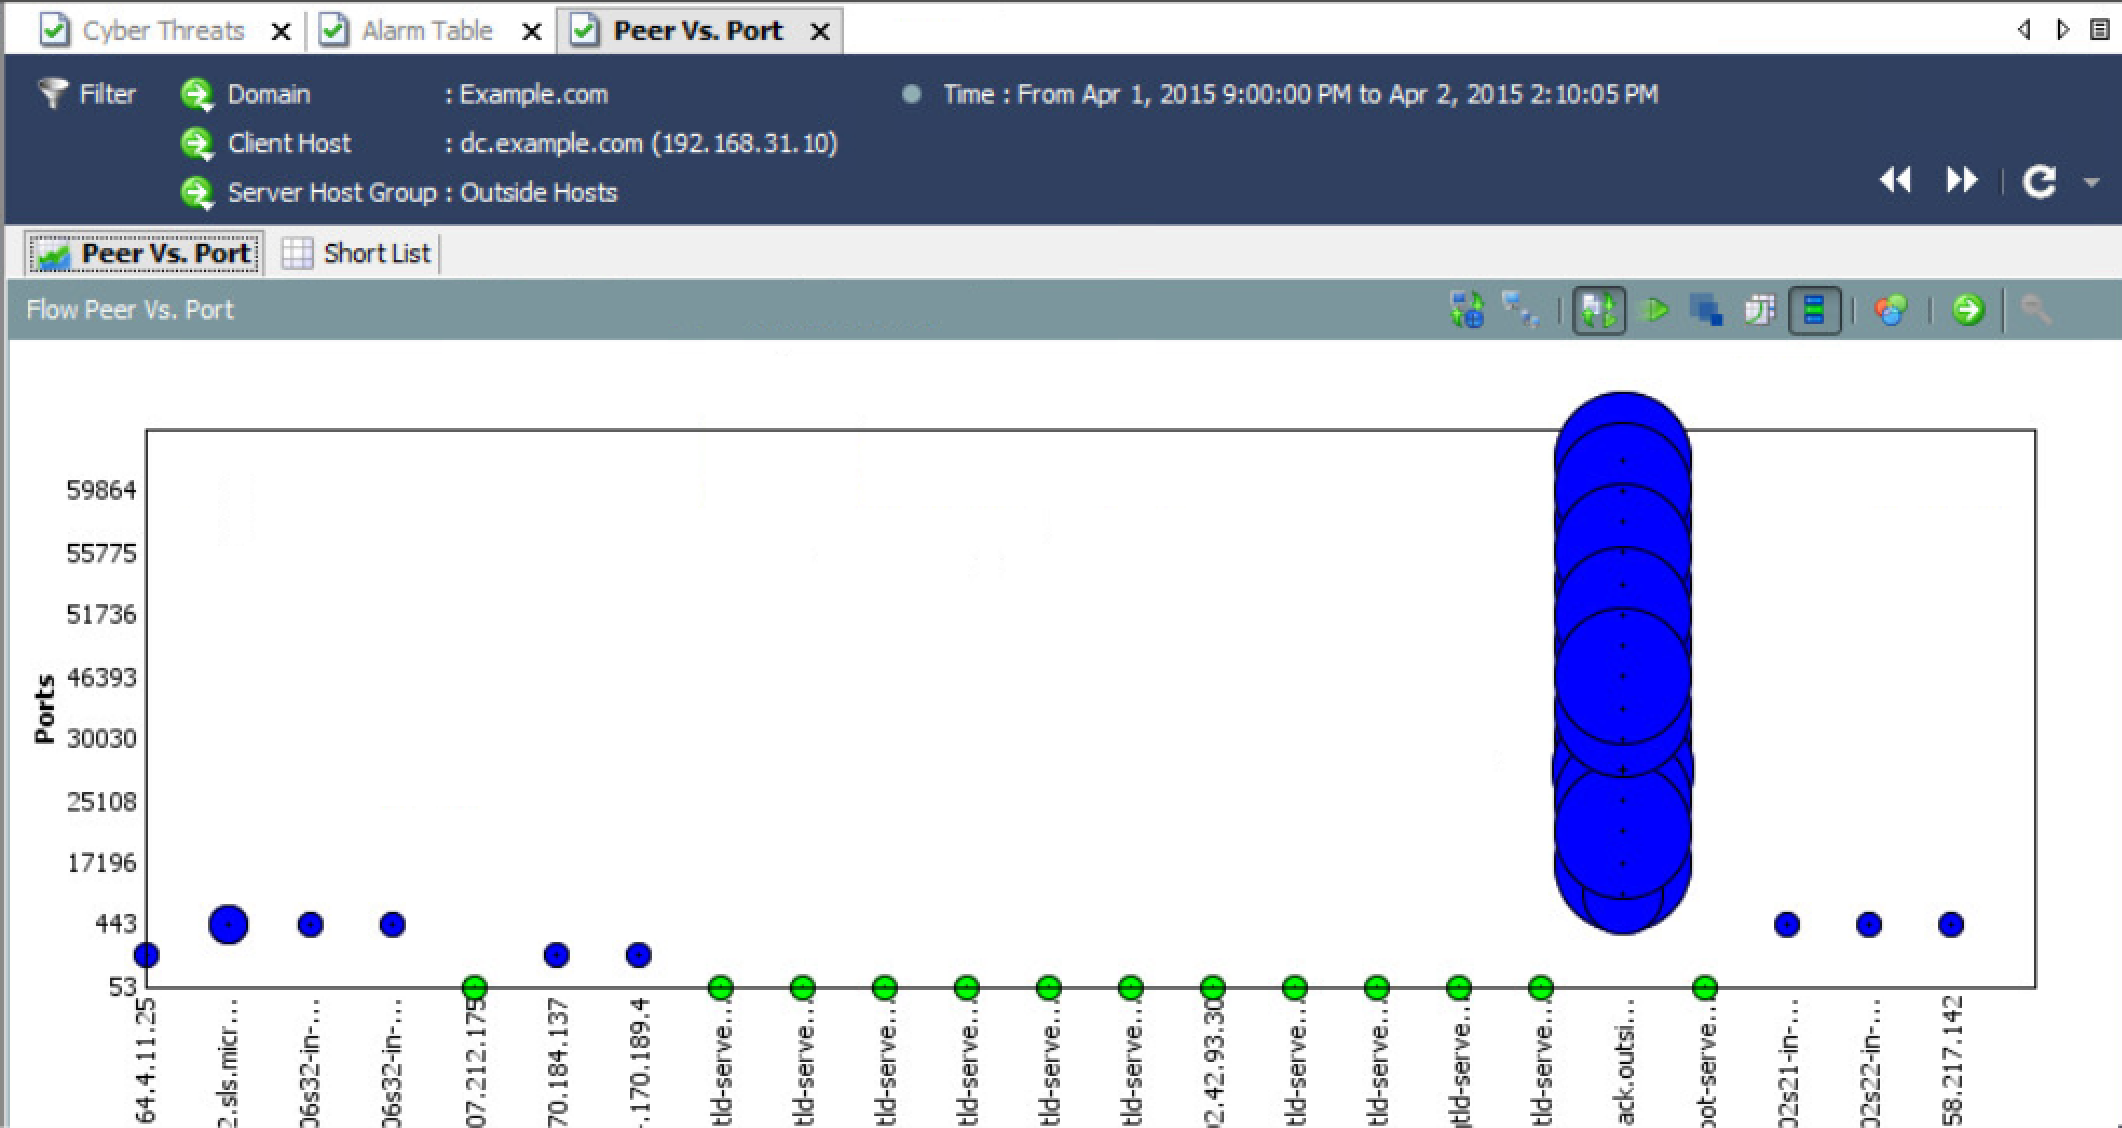
Here is an example of diving deeper into a data loss alarm using the java interface. As you can see, there are ways to get very specific details such as showing a compromised system bleeding data to an malicious server. I can see the every port used, where data is going and the amount of data that is being taken. Eventually I expect these types of searches to become available in future releases of the web GUI.
Related posts:
 Post NAC: Cisco Identity Services Engine (ISE) and Lancope StealthWatch for Total Access Control
 Identifying Advanced Persistent Threats ATP Using Netflow – Lancope StealthWatch Overview And Lab
 Using Lancope to identify Putter Panda, Heartbleed and other attacks
 Detecting Malware With ThreatGRID Overview