My latest project is setting up Splunk to manage various security solutions. One of those technologies is Cisco Stealthwatch. There are a few apps available to help with the process such as the Cisco Stealthwatch add on. The details are pretty straight forward. First, install the app and follow the setup. Next you need to setup Stealthwatch using the Java interface to send data to Splunk. Those steps are as follow:
1. Login into the SMC Java Applet
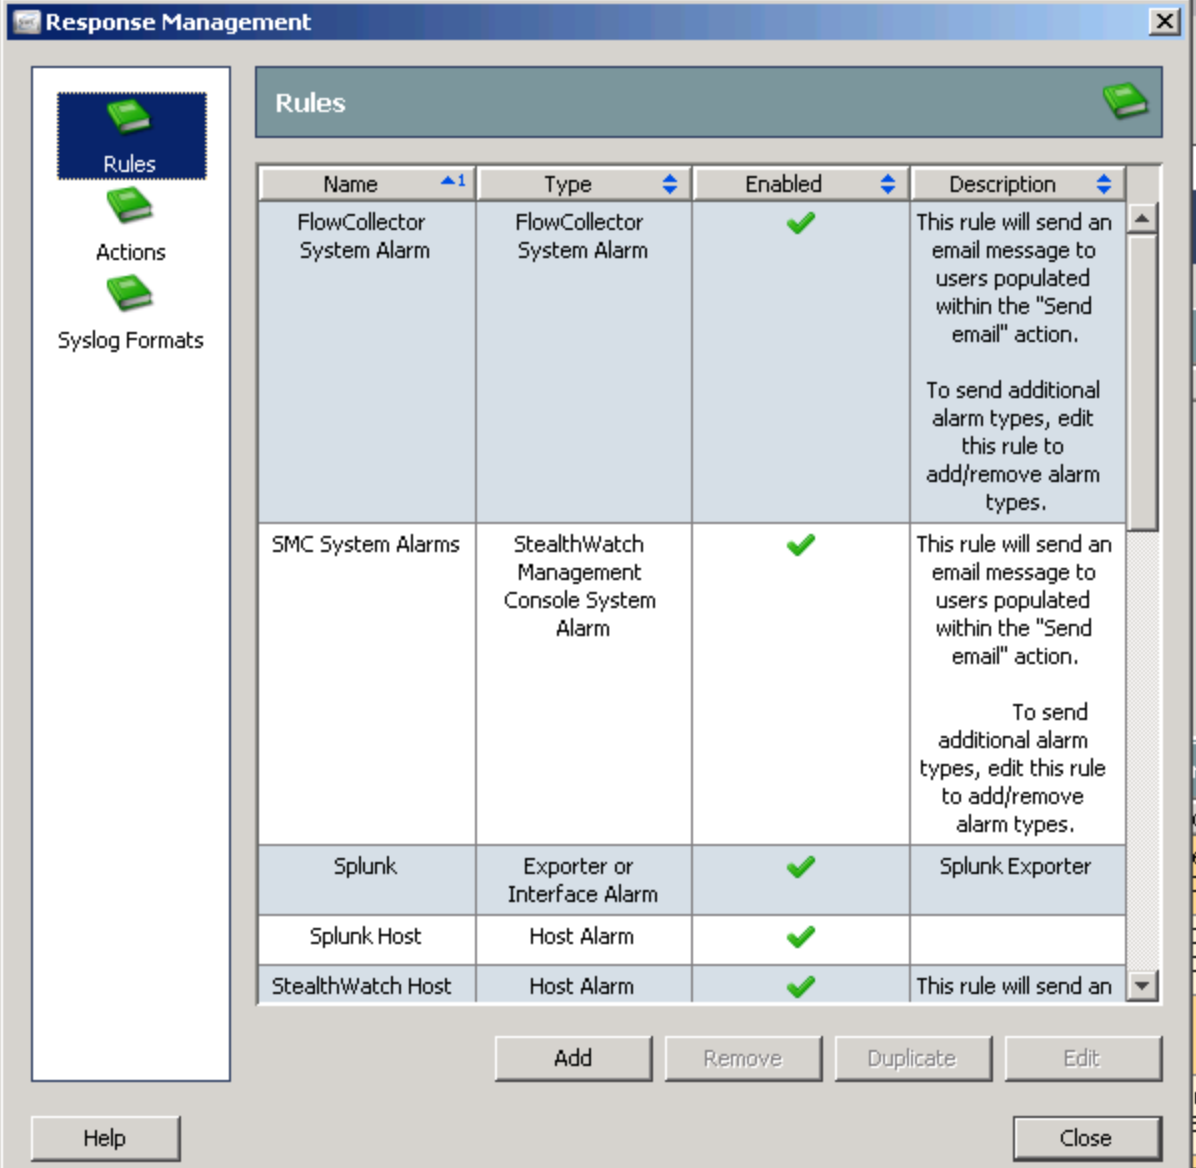
2. Navigate to Configuration > Response Management.
3. Click Syslog Formats.
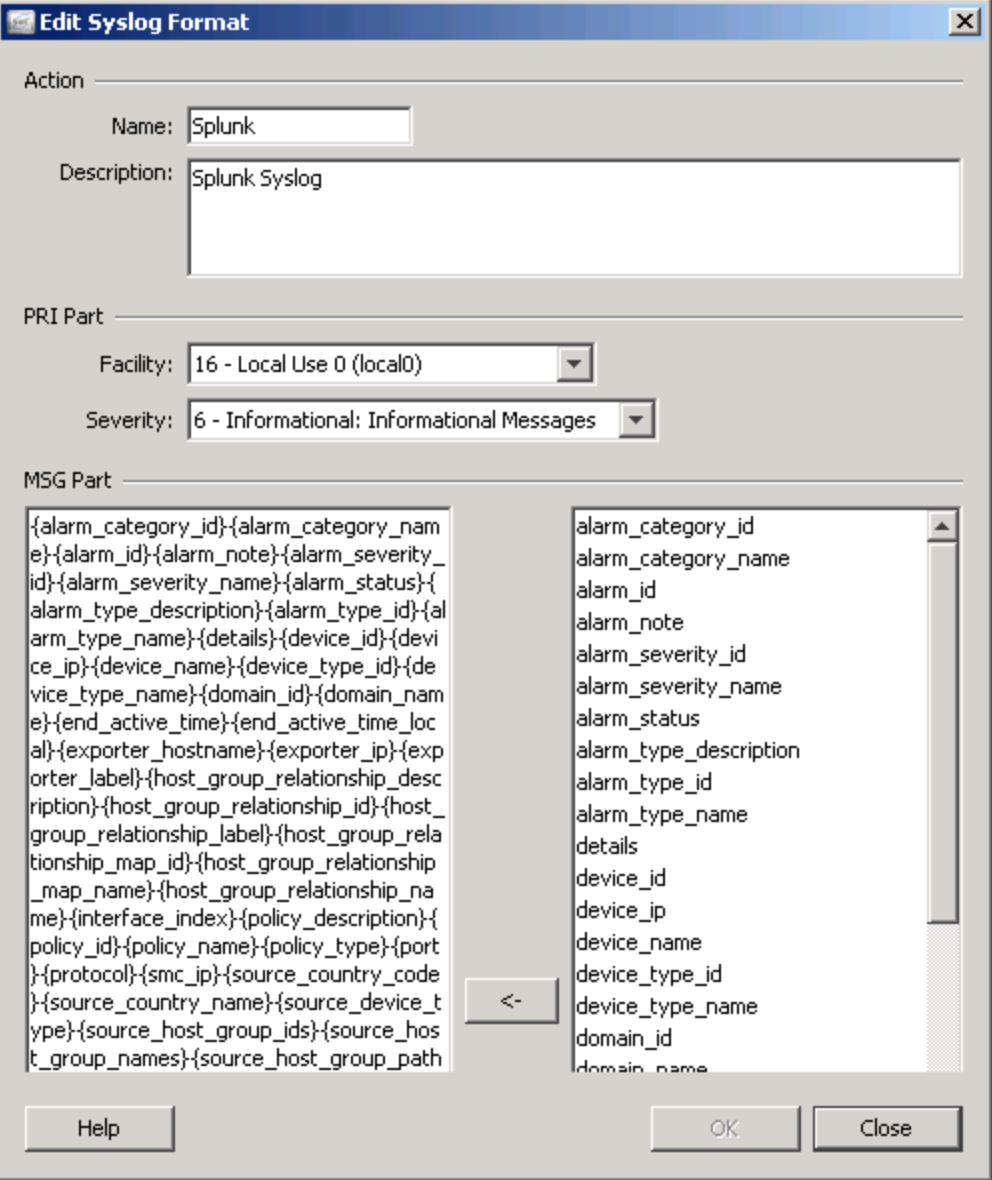
4. Use the table below to fill in the required fields
Name: Splunk
Enabled: Yes
Facility: 16 – Local Use 0 (local0)
Severity: 6 – Informational: Informational Messages
MSG Part: Use the message format needed for the add-on
Click OK.
6. Click Actions.
7. Use the table below to fill in the required fields!!!!
Name: Splunk
Enabled: Yes
IP Adress:
Port: 514
Format: Splunk
8. Click OK.
9. Click Rules.
10. Change the action of your rules and add Splunk
There are basically three things you need. You need rules to send data to Splunk. You can create a new and/or change the action for any rule to send data to splunk. You need an action that says to use a specific format whenever a event is triggered (set events this to 6 / informational). Finally, you need a format to send it. That is the Syslog Format section.
 The key step is to use the table they provide in the app. You do NOT want to just highlight and copy everything into MSG part such like this example.
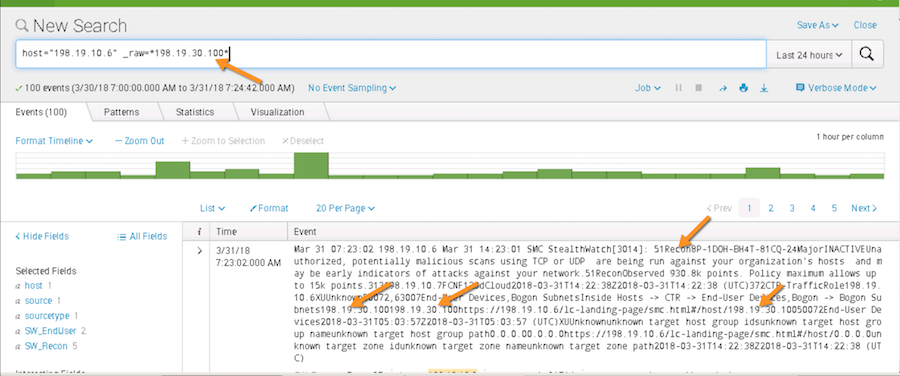
 This is WRONG and your data in Splunk will look like poo. You will try to find attackers and it will be mixed into the raw data in a ugly manner such as this. You don’t want ugly data.
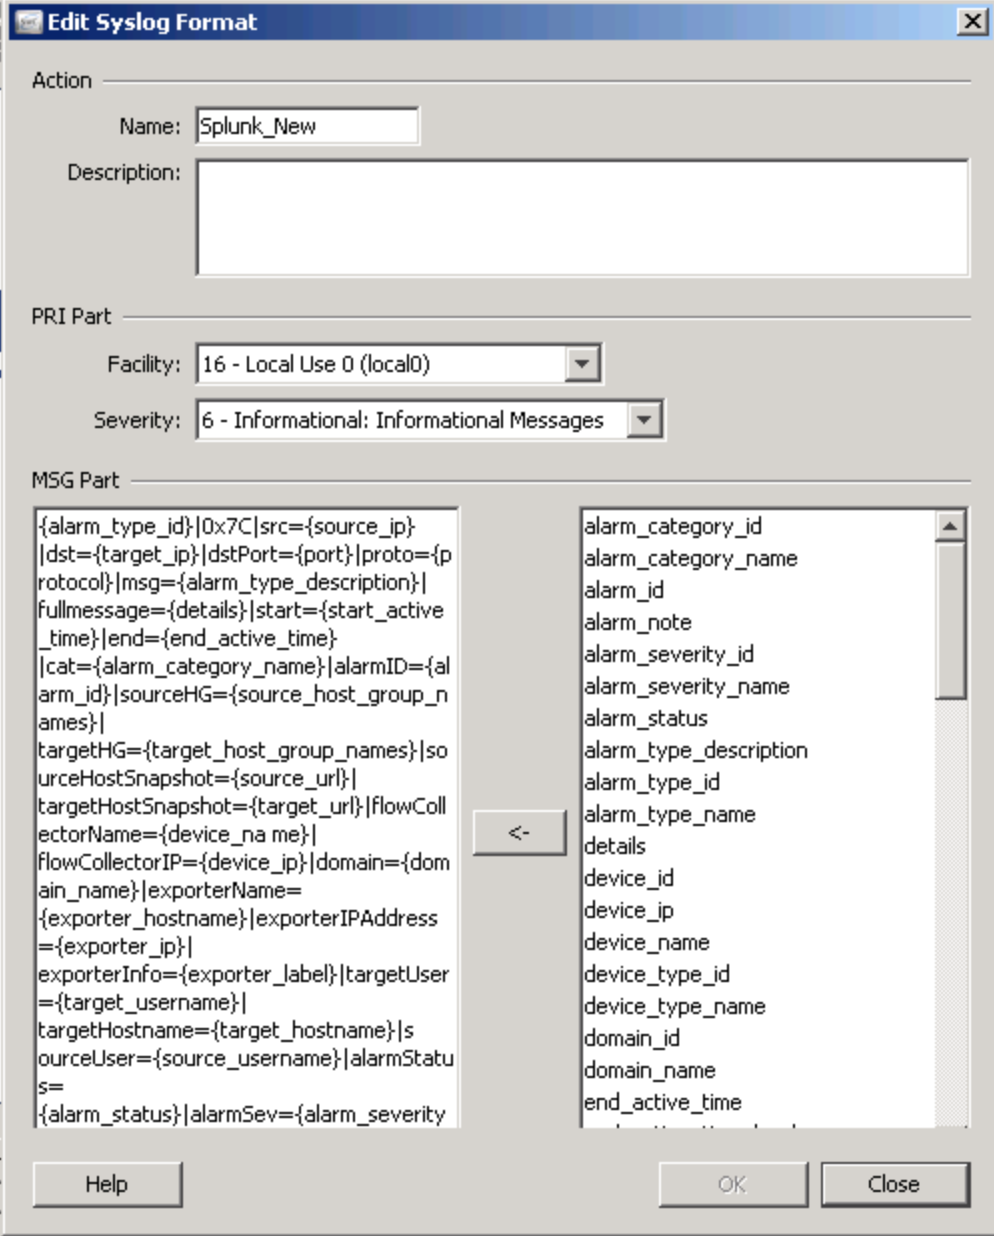
 Instead, use this format as suggested by the app in the MSG field.
Lancope|Stealthwatch|Notification: alarm_desc=”{alarm_type_description}” details=”{details}” dest={target_ip} src={source_ip} start={start_active_time} end={end_active_time} category={alarm_category_name} Alarm_ID={alarm_id} Source_HG={source_host_group_names} Target_HG={target_host_group_names} Source_HostSnapshot={source_url} Target_HostSnapshot={target_url} dest_port={port} transport={protocol} FC_Name={device_name} FC_IP={device_ip} Domain={domain_id} signature={alarm_type_name} vendor_severity={alarm_severity_name} severity_id={alarm_severity_id} alarm_type={alarm_type_id}
Or personally I like this one from a QRadar website adding Stewalthwatch. The categories are a bit cleaner.
{alarm_type_id}|0x7C|src={source_ip}

|dst={target_ip}|dstPort={port}|proto={protocol}|msg={alarm_type_description}|

fullmessage={details}|start={start_active_time}|end={end_active_time}

|cat={alarm_category_name}|alarmID={alarm_id}|sourceHG={source_host_group_names}|

targetHG={target_host_group_names}|sourceHostSnapshot={source_url}|

targetHostSnapshot={target_url}|flowCollectorName={device_na me}|

flowCollectorIP={device_ip}|domain={domain_name}|exporterName=

{exporter_hostname}|exporterIPAddress ={exporter_ip}|

exporterInfo={exporter_label}|targetUser={target_username}|

targetHostname={target_hostname}|s ourceUser={source_username}|alarmStatus=

{alarm_status}|alarmSev={alarm_severity_name}
So it should look like this
 Tune as you see fit. Maybe you want category instead of cat or destination port instead of dstPort. In the end your results will be much cleaner so you can quickly create fun dashboards.
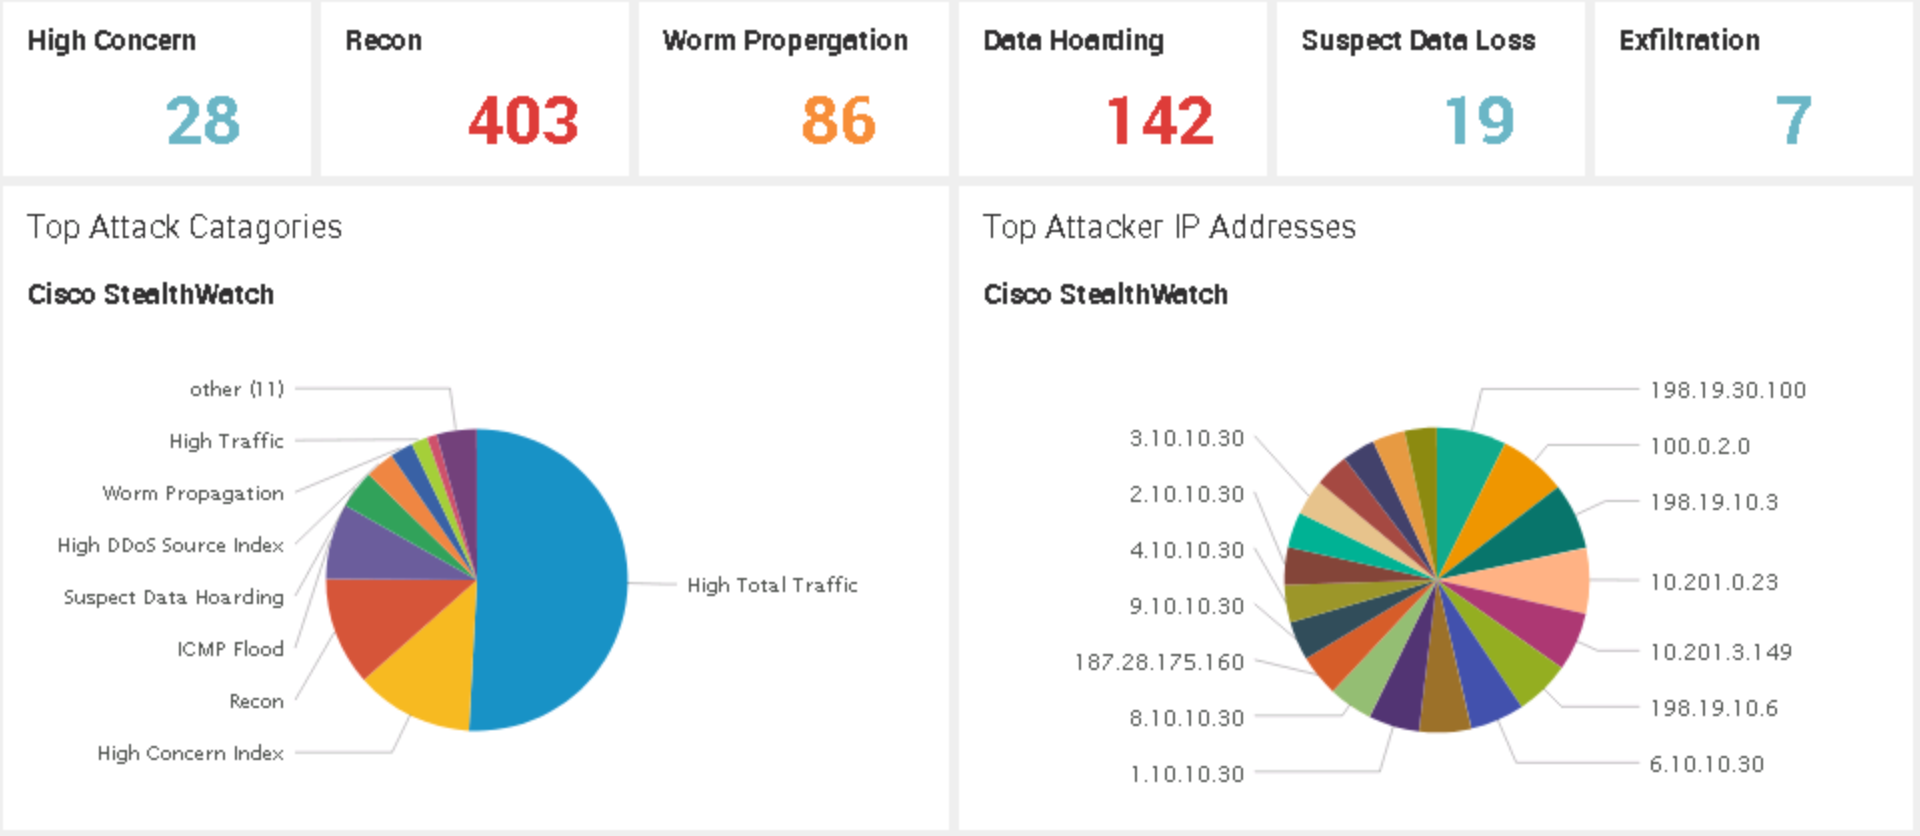 The entire process should take you 5-10 mins tops. Have fun
Related posts:
 Visual Investigations of Botnet Command and Control Behavior Infographic
 Splunk Cisco Security App – Expanding Cisco Security With Centralized Reporting and Multi-Vendor Alerting
 How to configure an ASA with built-in Sourcefire Firepower home lab
 Cisco Anyconnect 4.0 – Whats New – Why Consider – Free Migrations